The State of New Jersey Nonprofit Funding 2026
We analyzed every itemized grant reported by New Jersey-headquartered private foundations on IRS Form 990-PF — 134,000+ grants, fiscal years 2022–2024 — to map who gives, where the money goes, and how grant sizes are changing. Free to cite and republish with attribution and a link to this page.
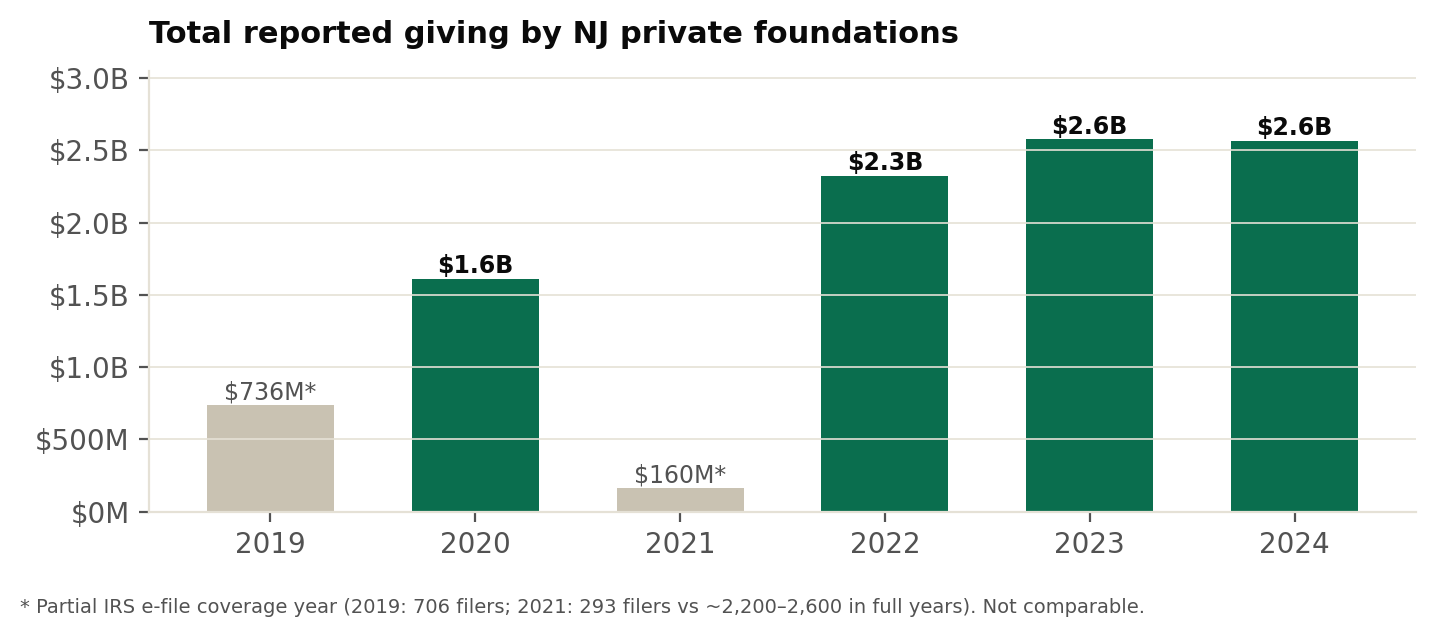
Giving is steady — but checks are getting bigger
NJ private foundations reported $2.57 billion in grants on FY2024 filings, level with 2023 and up 11% from 2022. The bigger shift is in the typical grant: the median rose from $3,000 in FY2020 to $5,000 in FY2024 (+67%), and the mean rose from $41,600 to $61,400. Foundations are concentrating dollars in fewer, larger awards.
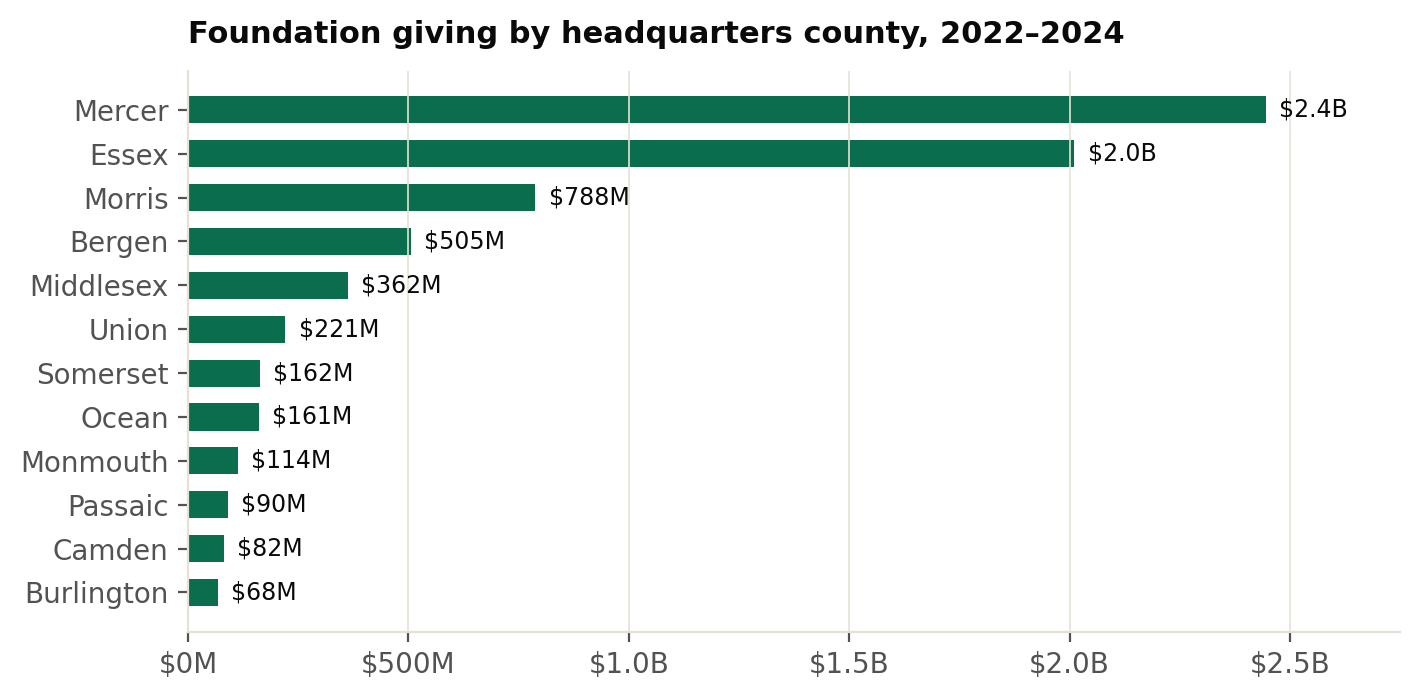
One county holds a third of the money
Mercer County — home of the Robert Wood Johnson Foundation in Princeton — accounts for $2.45B of FY2022–24 giving, a third of the state total, and posts the state's highest median grant ($15,000). Bergen County has the most foundations (375) but a $3,500 median: lots of small family foundations. County reflects the foundation's headquarters, not the recipient's location.
Full 17-row county table with medians, means, and grant counts in the PDF.
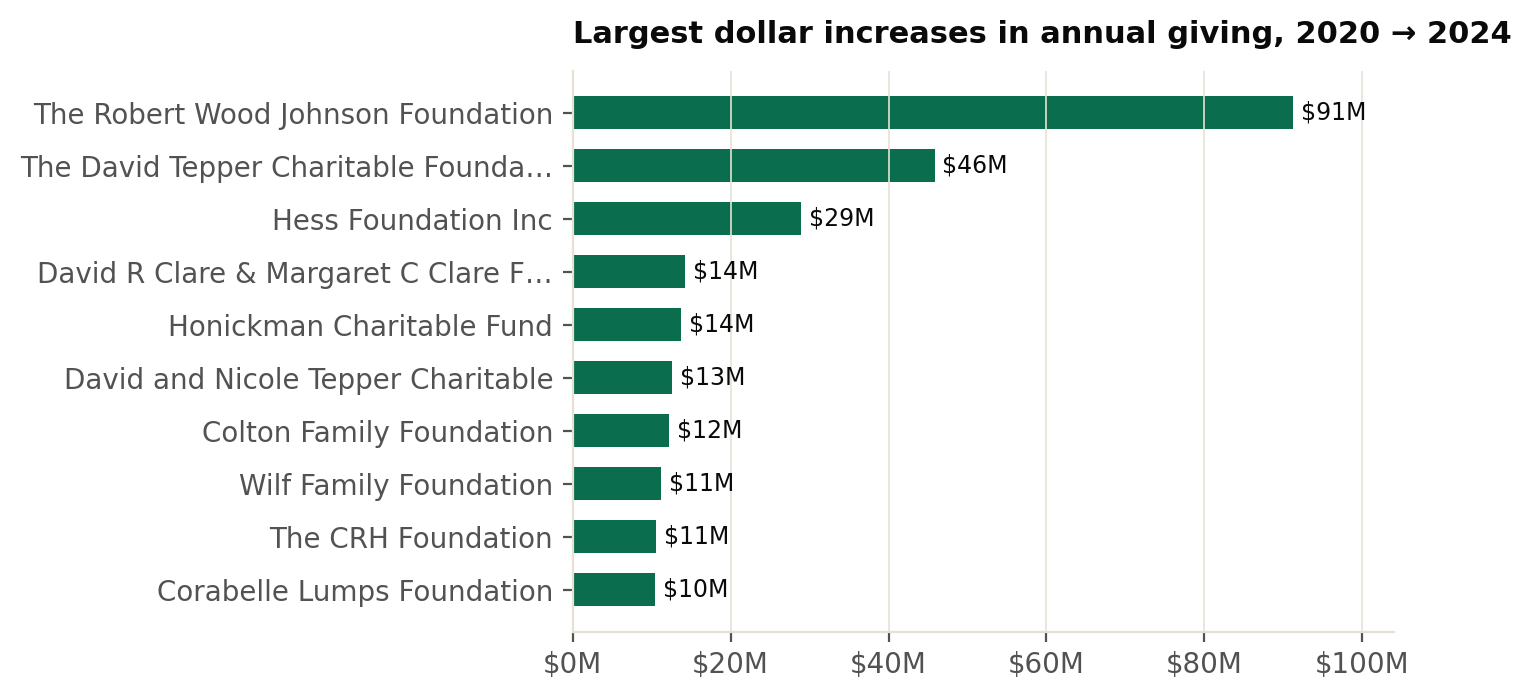
The fastest-growing NJ foundations
Comparing the same foundations' FY2020 and FY2024 filings (matched cohort of 2,028), RWJF added the most dollars (+$91M), but the sharpest expansions are family foundations scaling from six to eight figures — the Honickman Charitable Fund grew 66x, from $209K to $13.9M. A foundation in growth mode is often building new program areas: the best moment for an introduction.
All 50 growth foundations, ranked, in the PDF.
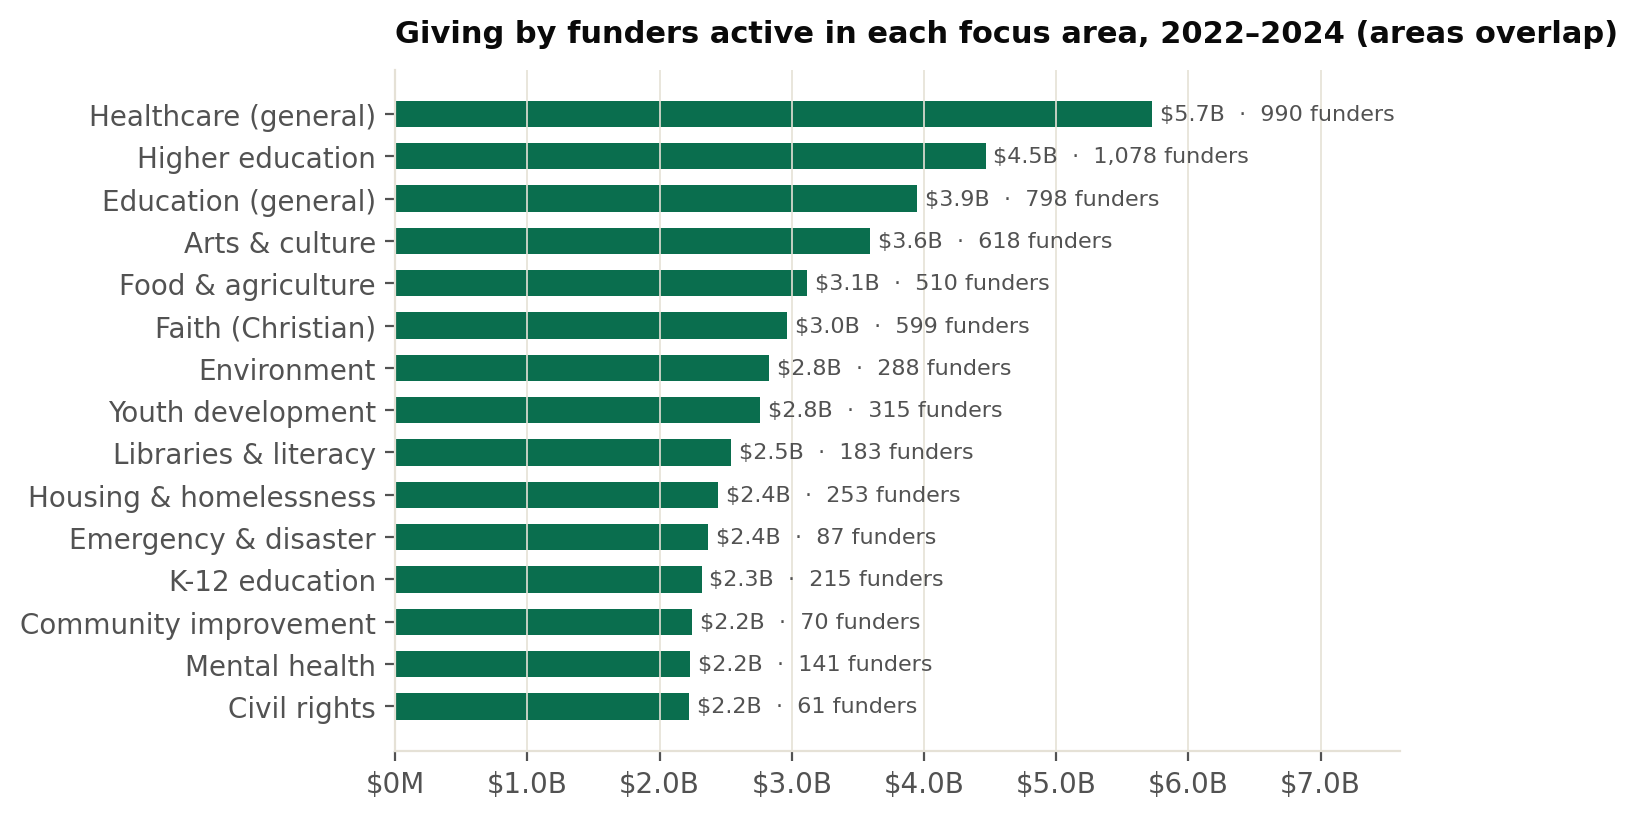
What gets funded
Healthcare leads: 990 foundations active in healthcare grantmaking deployed $5.7B in FY2022–24. The quieter story is at the bottom of the chart — causes like civil rights (61 funders) and community improvement (70) have few dedicated funders but large average commitments. Less competition for organizations that fit.
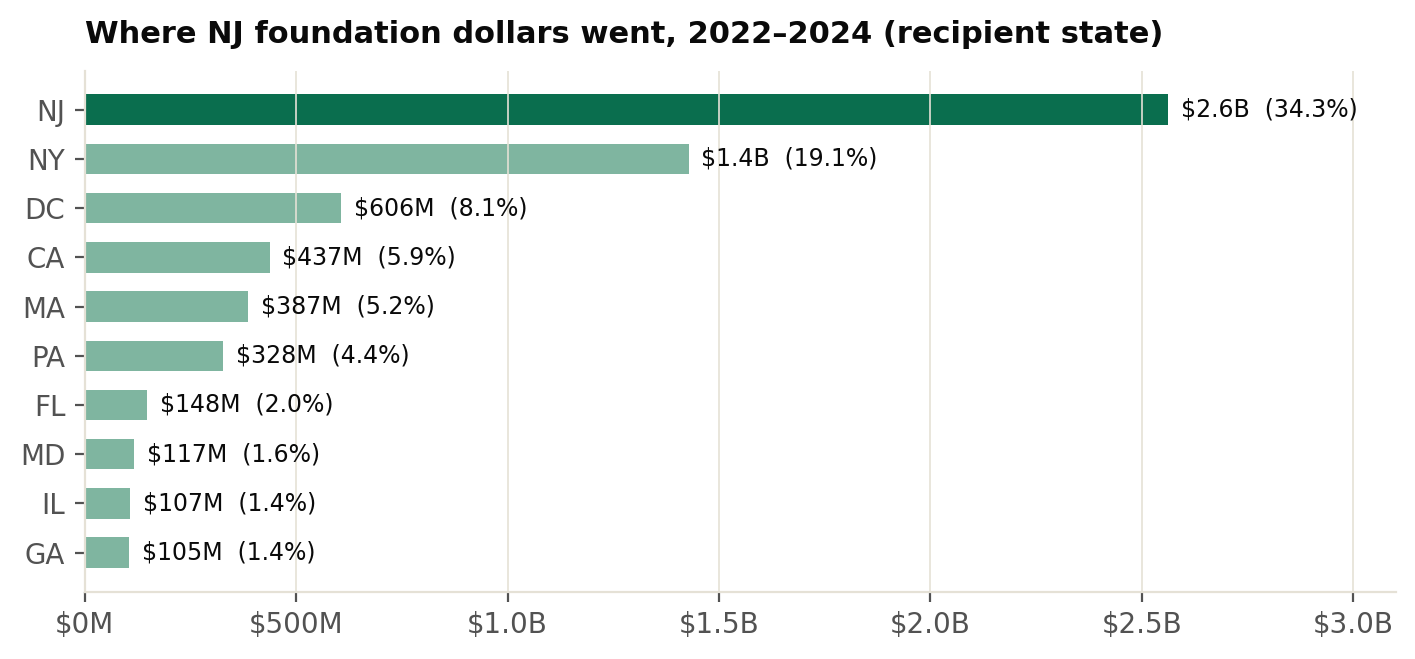
Most NJ foundation money leaves New Jersey
Of $7.46B granted in FY2022–24, only $2.56B (34.3%) went to New Jersey recipients. New York captured 19.1% — Manhattan's universities, hospitals, and national nonprofits sit one river away from most of NJ's foundation wealth — with DC and Massachusetts punching far above their size. For NJ nonprofits the implication is sharp: the money is local, the competition is national, and local impact is the differentiator.
Methodology
Scope. New Jersey-headquartered private foundations (IRS Form 990-PF filers), grants as itemized on their e-filed returns, tax years 2019–2024, as ingested by Bespoke Grants.
Exclusions. Nine pharmaceutical patient-assistance programs (J&J, Bristol-Myers Squibb, Novartis, Merck, Bayer, Otsuka, Sanofi, Genzyme, Teva) that report the retail value of free medication to individuals as grants — J&J alone reported $4.6B in FY2022, which would swamp every cash-giving statistic. Also excluded: single grant lines of $250M+ (in-kind distributions) and zero/negative amounts.
Coverage. IRS e-file availability varies by year; 2019 and 2021 are partial-coverage years and are flagged as such. All growth claims use matched cohorts — the same foundations compared against themselves.
Full methodology in the PDF. Questions about the data: nate@bespokegrants.ai.
This data has a day job
Bespoke Grants matches your nonprofit against 225,000+ foundations using the same IRS grant history behind this report — then drafts funder-specific letters of inquiry in your organization's own words. Free tier, no card.
Find your funders free →